Methanol analysis as transformer winding paper ageing marker – Correlation model based on post mortem transformer dismantling
Publication date: April 29, 2026

Steve Eeckhoudt, Stijn Autru, Marnix Vermeersch
ENGIE Laborelec, Linkebeek, Belgium
on behalf of the Phase 2 IERE collaborative project (active project members SINTEF (Norway), VAISALA (Finland), HD HYUNDAI ELECTRIC (South-Korea), KEPRI (South-Korea), TPRI (Taiwan), CLP (Hong Kong), CRIEPI (Japan), ENGIE (France) and TENNET (The Netherlands).
Abstract – The ageing of cellulose based insulation in power transformers is a critical determinant of operational lifespan and reliability. Traditional chemical markers such as 2 furfuraldehyde (2 FAL) are widely used in oil condition monitoring but present significant interpretative limitations. Methanol (MeOH), released during the scission of 1,4 β glycosidic bonds in cellulose, has emerged as a more sensitive and earlier stage indicator of paper degradation since 2007 [1] [2] [3]. In 2015 and 2018, a first basic model, drafted based on real-case transformer post-mortem inspections, was proposed as to interpret MeOH oil analysis values to estimate the degree of polymerisation (DP), i.e. the status of the winding paper ageing [4] [5].
This study presents the findings from an international, multi year research project during 2020 – 2024 period (‘IERE collaborative project’) aimed at further correlating temperature corrected MeOH concentration in insulating oil samples with the DP spread of the winding paper, determined through post mortem examinations of 27 decommissioned large power transformers. The strongest correlation (R² = 0.76) was observed for paper samples taken from the low voltage (LV) top winding location, which was identified as the most aged area within the transformer. These results validate the applicability of MeOH analysis as a predictive ageing tool, enabling more accurate residual life assessment of transformer which have very low or no 2-FAL formation. The proposed model, based on LV top data, can enhance transformer asset management strategies and potentially reduce reliance solely on the more conventional 2-FAL analysis.
Index terms – Ageing marker, solid insulation, methanol, post-mortem transformer dismantling.

INTRODUCTION
Cellulose based solid insulation, typically in the form of Kraft paper (KP) or thermally upgraded paper (TUP), is the primary life limiting component in oil immersed power transformers. Mechanical strength loss, primarily driven by thermal, hydrolytic, and oxidative degradation, is irreversible, and its progression determines the end of life condition for the unit. While direct measurement of cellulose degradation via DP testing is the most conclusive testing method, this requires de energization and destructive sampling, making it impractical for routine field assessment.
For decades, indirect chemical markers dissolved in insulating oil have been used to estimate paper condition. Among these, CO/CO₂ and 2 FAL have been most prevalent. However, their diagnostic value is constrained by factors such as marker volatility, oil-paper partition behaviour, contamination from non cellulosic sources, and susceptibility to maintenance induced resets. These limitations have motivated the search for complementary or superior indicators.
The MeOH analysis has emerged as a promising alternative. Produced directly during cellulose chain scission, MeOH is detectable at earlier degradation stages than 2 FAL and is generated from both KP and TUP, even at moderate operating temperatures. Laboratory kinetics studies have confirmed the strong mechanistic link between DP reduction and MeOH production for both KP and TUP [6] [7]. Phase 1 of the IERE collaborative project (2012-2017) demonstrated MeOH’s sensitivity across diverse transformer types [8]. Building on those results, Phase 2 (2020-2024 period) sought to establish a statistically robust correlation between MeOH concentrations (corrected to 20 °C to account for temperature dependent partitioning [9]) and winding paper DP, based on systematic post mortem sampling of retired large power transformer units.
II - METHODOLOGY
Collaborative framework
Phase 2 IERE collaborative project involved 9 large power utilities across Asia and Europe, coordinated by ENGIE Laborelec. Standard protocols ensured comparability of results.
Sampling approach
In total 27 large oil‑immersed power transformers were identified which were interesting for a post-mortem dismantling as to map the DP spread of the winding paper. Various OEMs, service ages, oil type, atmospheric protection and loading were concerned. In particular 4 specific ‘transformer winding locations’ (i.e. locations where the paper samples are cut out of the windings) were defined were to take paper samples: LV Top, LV Bottom, HV Top and HV Bottom. Prior to the decommissioning and post-mortem inspection, each transformer had at least 1 oil sampling campaign under stable high‑load conditions as to determine MeOH content and to calculate of the MeOH temperature-corrected at 20°C (MeOHcorr20°C). During these transformer dismantling when taken the winding paper samples, the CIGRE TB 735 [10] guidelines were followed as to allow safe, representative and adequate paper sampling and analysis.
Analytical methods
The content of MeOH was determined by GCMS method as per IEC TR 63025 (Ed. 2021) and the analysis of DP was done as per IEC 60450 (Ed. 2004).
Modelling
Logarithmic regression of MeOHcorr20°C versus DP per transformer winding location. Coefficient of determination (R²) was calculated per paper sampling location and also the 95% interval of confidence was calculated per dataset, i.e. a dataset is composed out of several DP-values from 1 particular transformer winding location.
III - RESULTS
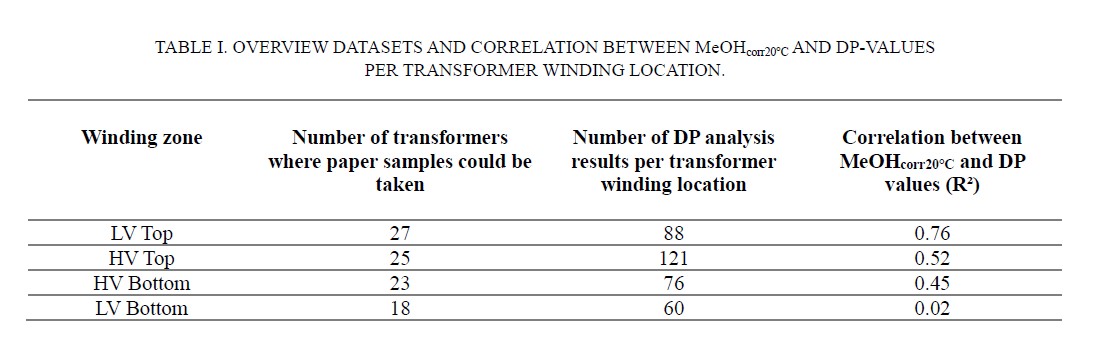
Table I gives an overview of the number of power transformers where winding paper samples could be taken, the total number of winding paper samples taken per transformer winding location and the correlation (expressed through the coefficient of determination) between the MeOHcorr20°C and DP values.
Figure 1 illustrates for the 4 transformer winding locations the ‘DP-spread’ in function of the MeOHcorr20°C value. DP-spread should be seen as a set of DP-values of winding paper samples at 1 of the 4 specific transformer winding locations which are visualised by the mean value of this set of DP-values and the 95% interval of confidence of this dataset. As a reference, the correlation model formulated in [5] is given through a dashed line in the graphs of figure 1.
Figure 2 shows a combined graphical correlation for 3 of the transformer winding locations. For each of these locations, the average DP found is plotted in function of the MeOHcorr20°C value. The 4th transformer winding location (LV bottom) is not visualised as very low R2 value.
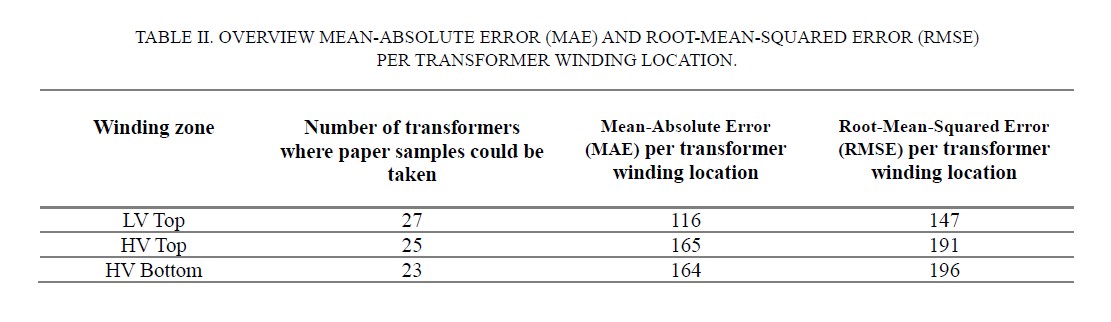
Table 2 shows the Mean-Absolute Error (MAE) and Root-Mean-Squared Error (RMSE) for 3 different transformer winding locations as to better quantify the prediction accuracy of the formulas indicated in Figure 1.
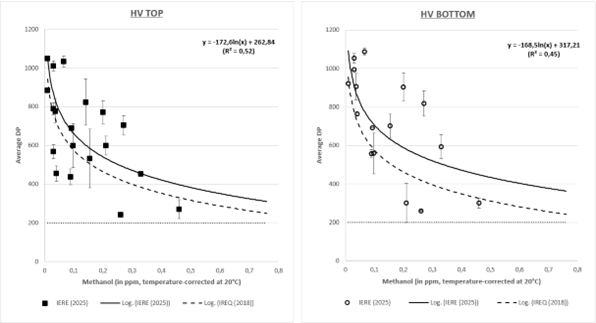
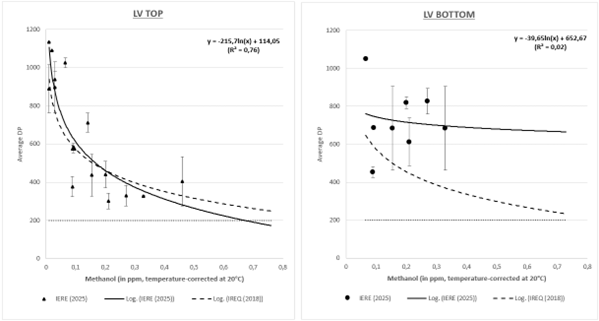
Figure 1: Correlation between MeOHcorr20°C and DP for the different transformer winding locations.
Regression lines, its correlation formula and its R² values are shown through a full line for each of the 4 transformer winding locations. The dotted line represents the end-of-life criterion of the transformer winding paper (DP-value of 200). The dashed line is the correlation model formulated by IREQ in 2018 [5].
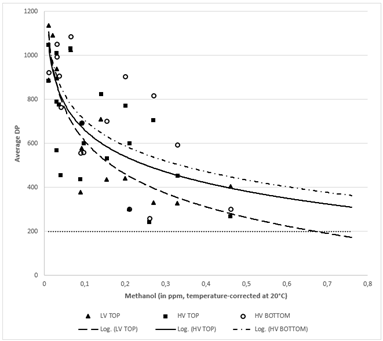
Figure 2: Comparative ageing profiles by transformer winding location.
IV - OBSERVATIONS
Figures 1 and 2 show clearly that the DP values are lowest at LV Top location, which is consistent with higher thermal stresses. The HV zones show significantly milder degradation of the winding paper. An important factor to take into consideration is that the availability of the limited high MeOHcorr20°C data sets restricts the assessment accuracy in advanced ageing range (DP values of 300 and below). Only 1 dataset has MeOHcorr20°C values > 0.33ppm.
As indicated in figure 2, for a given concentration of MeOHcorr20°C >0.05ppm, the lowest DP value is recorded for LV Top location. Based on the observations, it seems appropriate to use the below equation (1) related to LV Top as to assess the lowest DP value (weakest spot) inside the windings based on methanol analysis:
DP = – 215,7 * ln ([MeOHcorr20°C]) + 114,05 (1)
where [MeOHcorr20°C] expressed in ppm
This above equation (1) is quite similar to the commonly used equation elaborated in 2018 in [5]. One main difference is that the equation in [5] is used to assess the average DP inside a transformer, whereas the equation expressed in this article can be used to estimate the lowest DP inside a transformer.
As mentioned earlier, a limitation of this study is the lack of data in the high methanol concentration range (>0.33 ppm), which is critical for assessing transformers nearing end-of-life. These findings suggest future dismantling efforts should prioritize on LV Top paper sampling, especially for transformers where historical MeOHcorr20°C results are in the 0.30-0.70ppm range as to further improve the accuracy of the winding paper ageing assessment.
The R² of 0.76 for the datasets from the LV Top zone could be considered as acceptable for reliable assessment, especially considering that the transformer fleet that was dismantled is very heterogenic: different ratings, different design, different oil type, different winding paper, different atmospheric protection, different maintenance and loading history.
The Mean-Absolute Error (MAE) and Root-Mean-Squared Error (RMSE) for 3 different transformer winding locations are considered as relatively high and can be related to the fact that the dismantled fleet was very heterogenic. The MAE and RMSE could be improved by processing data of other/future dismantlings and if transformers could be grouped (similar oil type, design, atmospheric protection) in more homogenic families.
V - CONCLUSIONS AND NEXT STEPS
This report presents the final outcomes of a five-year international collaborative research project on the correlation between MeOHcorr20°C values and DP values found during transformer dismantling. Post-mortem dismantlings of 27 power transformers were performed, taking winding paper samples at 4 transformer zones (winding locations), generating a robust dataset to correlate with the historical oil analyses in particular the MeOHcorr20°C values.
As shown in figure 1, the below equation could be found for the transformer zone with the most severe paper degradation, namely the LV Top zone:
DP = – 215,7 * ln ([MeOHcorr20°C]) + 114,05 (R²=0.76)
where [MeOHcorr20°C] expressed in ppm
This shows the potential of methanol as winding paper ageing marker for transformers where furans have little or no added value, i.e. for transformers where because of transformer materials used and its design no or very low concentrations of furans are formed during the in-service life.
A limitation of this study is the lack of data in the high methanol concentration range (>0.33ppm), which is critical for assessing transformers nearing end-of-life. These findings suggest that for future dismantling efforts should prioritize on LV Top paper sampling, especially for transformers where historical MeOHcorr20°C results are in the 0.30-0.70ppm range as to further improve the accuracy of the winding paper ageing assessment. Processing of data of other/future dismantlings and grouping of transformers (similar oil type, design, atmospheric protection) in more homogenic families could also improve accuracy of the prediction formulas.
VI - REFERENCES
[1] Y Denos, A Tanguy, J Jalbert, R Gilbert, P Gervais, P Guunic, “Ageing diagnosis by chemical markers influence of core-type and shell-type technology,” in CIGRE Session, Paris, August 22-27 2010.
[2] J Jalbert, R Gilbert, Y Denos, P Gervais, “Methanol: a novel approach to power transformer asset management,” IEEE Trans. Power Delivery, Vols. 27, n°2, April 2012.
[3 ] A Schaut, S Autru, S Eeckhoudt, “Application of methanol as a new marker for paper degradation in power transformers,” IEEE Trans. On dielectrics and Electrical Insulation, Vols. 18, n°2, April 2011.
[4] J Jalbert, MC Lessard, “Cellulose Chemical Markers Relationship with Insulating Paper Post-Mortem Investigations,” IEEE Trans. Dielectr. Electr. Insul. , Vols. 22, N°6, December 2015.
[5] J Jalbert, C Rajotte, MC Lessard, M Rodriguez-Celis, “Methanol in Oil Interpretation Model Based on Transformer Post-Mortem Paper Analysis,” IEEE, Vols. Vol. 25, N°2, April 2018.
[6] R GIlbert, J Jalbert, P Tétreault, B Morin, Y Denos, “Kinetics of the production of chain-end groups and methanol from the deplolymerization of cellulose during the ageing of paper/oil systems. Part 1: Standard wood kraft insulation,” Cellulose, vol. 16, 2009.
[7] R GIlbert, J Jalbert, S Duchesne, P Tétreault, B Morin, Y Denos, “Kinetics of the production of chain-end groups and methanol from the depolymerization of cellulose during the ageing of paper/oil systems. Part 2: ,Thermally-upgraded insultating papers,” Cezllulose, vol. 17, 2010.
[8] IERE collaborative project Phase 1 report, “Applications of Methanol as an Innovative Ageing Marker for Transformer Insulating Paper Diagnosis”, January 15th 2017.
[9] J Jalbert, MS Lessard, “Cellulose chemical markers in transformer oil insulation. Part 1: Temperature correction factors,” IEEE Trans. Dielectr. Insul., Vols. 20, N°6, pp. 2287-2291, 2013.
[10] CIGRE, “Transformer Post-Mortem Analysis”, TB 735, CIGRE, June 2018.